

15 Recruitment KPIs You Must Track in 2026 (With Examples)

Recruitment has never been short on metrics. Most recruiting firms can tell you their Time to Fill, how many CVs went out last week, or how many interviews were booked.
What’s far less common is clear visibility into whether all that activity is actually driving revenue, margin, and sustainable growth.
In this blog, we outline the most important recruitment KPIs for 2026 those that distinguish merely busy teams from truly high-performing firms along with practical examples to help you measure and improve your recruiting performance
What Are Recruitment KPIs and What’s Changed in 2026?
Recruitment KPIs are measurable indicators that show whether a firm is operating at the level it needs to.
Most firms already track familiar numbers: Time to Fill, CVs sent, interviews booked. These metrics are useful. They show activity and effort across the desk.
What they don’t always show is whether that activity is translating into revenue, profit, and a business that scales efficiently.
And that distinction matters far more in today’s market.
In 2026, hiring volumes are less predictable. Clients expect speed and precision at the same time. Candidates have more choice and less patience for slow, manual processes.
Teams that rely purely on activity metrics are increasingly exposed. The firms pulling ahead are the ones monitoring their economics just as closely as their pipeline activity.
Recruitment KPIs vs Recruitment Metrics
Recruiting KPIs and recruiting metrics are often used interchangeably, but they are fundamentally different.
| Aspect | Recruitment KPI (Key Performance Indicator) | Recruitment Metrics |
| Definition | Measures progress toward strategic business goals Example: Revenue per Recruiter (? $300k/year) |
Tracks process performance Example: Number of Submittals per Week |
| Focus | Strategic / outcome-driven Example: Client Retention Rate (80%+) |
Operational / activity-driven Example:Submission-to-Interview Ratio (4:1) |
| Tie to Business Goals | Directly linked to team growth & sustainability Example: Search Completion Rate (90%+) |
May support a KPI, but not always strategic Example: Time to Submit First Candidate |
| Purpose | Shows if the recruiting firm is winning overall Example: Quality of Hire (12-month retention 85%+) |
Helps diagnose issues in the funnel Example: Candidate Drop-off Rate |
| Typical Number Tracked | Limited set of critical measures (typically 5–10 KPIs) | Broad set of operational indicators (can range from 20–40+ metrics) |
| Time Orientation | Has a clear target & timeframe Example: EBITDA Growth for the year |
Continuous tracking; target optional Example: Average Response Time to Candidates |
| Actionability | Drives strategic decisions Example: Offer Acceptance Rate target tied to compensation |
Drives daily/weekly adjustments Example: Application Completion Rate |
| Test Question | “If this KPI is not met, does strategy change?” Example KPI: Predictable % of Revenue from Retained Searches |
“Does this explain or improve a KPI?” Example Metric: Hours Saved per Hire via AI tools |
| Analogy | Scoreboard (Are we winning?) | Play-by-play commentary (What’s happening?) |
15 Recruitment KPIs You Must Track in 2026
1. Gross Profit per Staff Member (FTE)
Shows how much gross profit your firm generates for every person on payroll. It’s one of the fastest ways to tell whether headcount growth is actually improving productivity — or quietly diluting it.
How to calculate it: Divide total gross profit by your full-time headcount.
Quick example: If your firm generates $2,000,000 in gross profit with a team of 14, your gross profit per staff member comes out to $142,857.
If revenue is rising but profit per head is flat (or falling), that’s usually an early signal that efficiency is slipping.
2. Gross Profit per Income Producer
This metric isolates the productivity of your fee earners. While overall GP per head shows company-wide efficiency, this one tells you whether your billers are truly carrying their weight.
How to calculate it: Divide total gross profit by the number of fee-earning consultants.
Quick example: If your firm generates $2,000,000 in gross profit with 8 fee earners, gross profit per income producer equals $250,000.
Benchmarks vary widely by market and desk maturity, but strong firms watch the trend closely. If this number stalls while headcount grows, it usually points to desk-level performance gaps or uneven workload distribution.
3. Gross Profit Multiple (Total)
Think of this as a reality check on how efficiently salary spend is being converted into gross profit. It shows how many dollars of GP you generate for every dollar spent on staff compensation.
How to calculate it: Divide total gross profit by total staff salary cost.
Quick example: $2,400,000 gross profit divided by $1,600,000 in salary costs gives a multiple of 1.5×.
Healthy firms typically aim to stay comfortably above breakeven territory. If this multiple starts compressing, it’s often an early sign that costs are rising faster than productivity.
4. Gross Profit Multiple (Income Producers Only)
This version zooms in on your billers and answers a blunt question: are your revenue generators producing enough to justify their cost?
How to calculate it: Divide total gross profit by the total salary cost of fee-earning consultants only.
Quick example: If gross profit is $2,000,000 and consultant salary cost is $650,000, the multiple is 3.08×.
Across the industry, the informal rule of thumb is that consultants should bill roughly three times their base salary. Consistently falling below that level usually signals pricing, productivity, or desk discipline issues worth investigating.
5. Staff Cost as a Percentage of Gross Profit
This metric shows how much of your gross profit is being consumed by payroll. It’s simple — but incredibly revealing when tracked over time.
How to calculate it: Divide total salary cost by total gross profit, then multiply by 100.
Quick example: $900,000 in salary costs against $2,000,000 gross profit equals 45%.
Most healthy teams try to keep this somewhere around the mid-40s to low-50s. The real danger is slow creep. A few compensation changes and a soft quarter can push this ratio up quietly, and by the time it’s noticed, margins are already under pressure.
6. EBIT as a Percentage of Gross Profit
This metric shows how much of your gross profit actually makes it through to operating profit after overheads. It’s where many firms discover the gap between strong billings and real profitability.
How to calculate it: Divide EBIT by gross profit and multiply by 100.
Quick example: $600,000 EBIT on $2,000,000 gross profit equals 30%.
Well-run firms typically aim to keep this comfortably in the mid-20s or higher. If the number starts sliding, it usually points to overhead creep rather than a top-line problem.
7. EBIT as a Percentage of Revenue
While the previous metric looks inward, this one shows your true bottom-line health relative to total billings. It’s also one of the first numbers investors and acquirers look for.
How to calculate it: Divide EBIT by total revenue and multiply by 100.
Quick example: $600,000 EBIT on $5,000,000 revenue equals 12%.
For many perm and exec search firms, anything in the 7–10% range is considered strong, with top-performing firms pushing beyond that. Revenue growth without margin discipline tends to show up very clearly here.
8. Profit per Staff Member
This is the bottom-line companion to gross profit per head. Instead of looking at contribution, it shows how much actual profit each employee supports.
How to calculate it: Divide EBIT by total headcount.
Quick example: $600,000 EBIT with 15 employees equals $40,000 per head.
There’s no universal benchmark, but the direction of travel matters. If headcount grows while profit per employee shrinks, scalability is starting to come under pressure.
9. Time to Fill
Time to Fill measures how quickly your firm converts a job order into a completed placement. In a market where clients increasingly value speed, this metric often becomes a competitive differentiator.
How to calculate it: Subtract the job open date from the date the role is filled.
Quick example: Job opened March 1 and filled April 5 = 35 days.
For many mid-level roles, landing in the 28–35 day range is considered strong. Senior and niche searches naturally run longer. What matters most is consistency — sudden slowdowns usually signal pipeline or qualification friction.
10. Time to Hire
Time to Hire zooms in on recruiter execution speed. Unlike Time to Fill, it starts the clock from first candidate contact rather than job intake.
How to calculate it: Subtract the date of first contact with the placed candidate from the offer acceptance date.
Quick example: First contact March 10, offer accepted April 2 = 23 days.
Strong perm desks often land in the 21–28 day window for mid-level roles. Because this metric isolates recruiter-side efficiency, it’s especially useful for diagnosing workflow bottlenecks inside the team.
11. Job Take-to-Fill Ratio
This metric shows how many of the roles you accept actually convert into revenue. It’s one of the clearest indicators of job qualification discipline.
How to calculate it: Divide jobs filled by jobs taken and multiply by 100.
Quick example: If you take 20 roles and fill 10, your ratio is 50%.
Most perm firms typically operate in the 40–65% range. If the number drops consistently, it often means consultants are taking on roles that were never truly fillable.
12. CCI-to-Placement Ratio
This is one of the most practical conversion metrics in firm recruiting. It tells you how many client-candidate interviews are needed to produce one placement.
How to calculate it: Divide total client-candidate interviews by total placements.
Quick example: 40 interviews resulting in 10 placements gives a 4:1 ratio.
For perm desks, 3:1 to 5:1 is generally healthy. When the ratio starts drifting higher, the issue is rarely effort — it’s usually matching quality, role qualification, or client calibration.
13. Offer Acceptance Rate
Offer Acceptance Rate measures how often your hard work actually closes. By the time an offer is on the table, most of the cost of delivery has already been incurred.
How to calculate it: Divide offers accepted by total offers extended and multiply by 100.
Quick example: 18 accepted offers out of 20 equals 90%.
Strong firms typically sit in the 85–95% range. Persistent drops here usually point to expectation misalignment earlier in the process rather than a problem at the offer stage itself.
14. Debtor Days (DSO)
Debtor Days shows how quickly your firm turns invoices into cash. Many profitable firms on paper quietly struggle here.
How to calculate it: Divide accounts receivable by total credit sales and multiply by the number of days in the period.
Quick example: $900,000 receivables on $6,000,000 annual credit sales equals roughly 55 days.
Best-run firms typically keep this in the 28–45 day window. Once it consistently crosses 50+, working capital pressure tends to follow.
15. Application Completion Rate
This metric is especially important for high-volume and retained search workflows. It shows how many candidates actually finish the process once they start.
How to calculate it: Divide completed applications by total applications started and multiply by 100.
Quick example: 300 completed applications out of 1,000 starts equals 30%.
Across online applications, averages are often surprisingly low. What matters most is trend direction — steady improvements here usually translate directly into a healthier top of funnel.
How Recruiterflow Helps You Track Recruitment KPIs
Most firms don’t struggle with knowing which KPIs to track. They struggle with getting clean, real-time visibility without wrestling spreadsheets.
That’s where the underlying system matters.
Recruiterflow brings KPI tracking into the day-to-day workflow by combining ATS, CRM, automation, and analytics in one platform.
Instead of exporting reports, teams can set targets at the org, team, or individual level and monitor progress continuously.
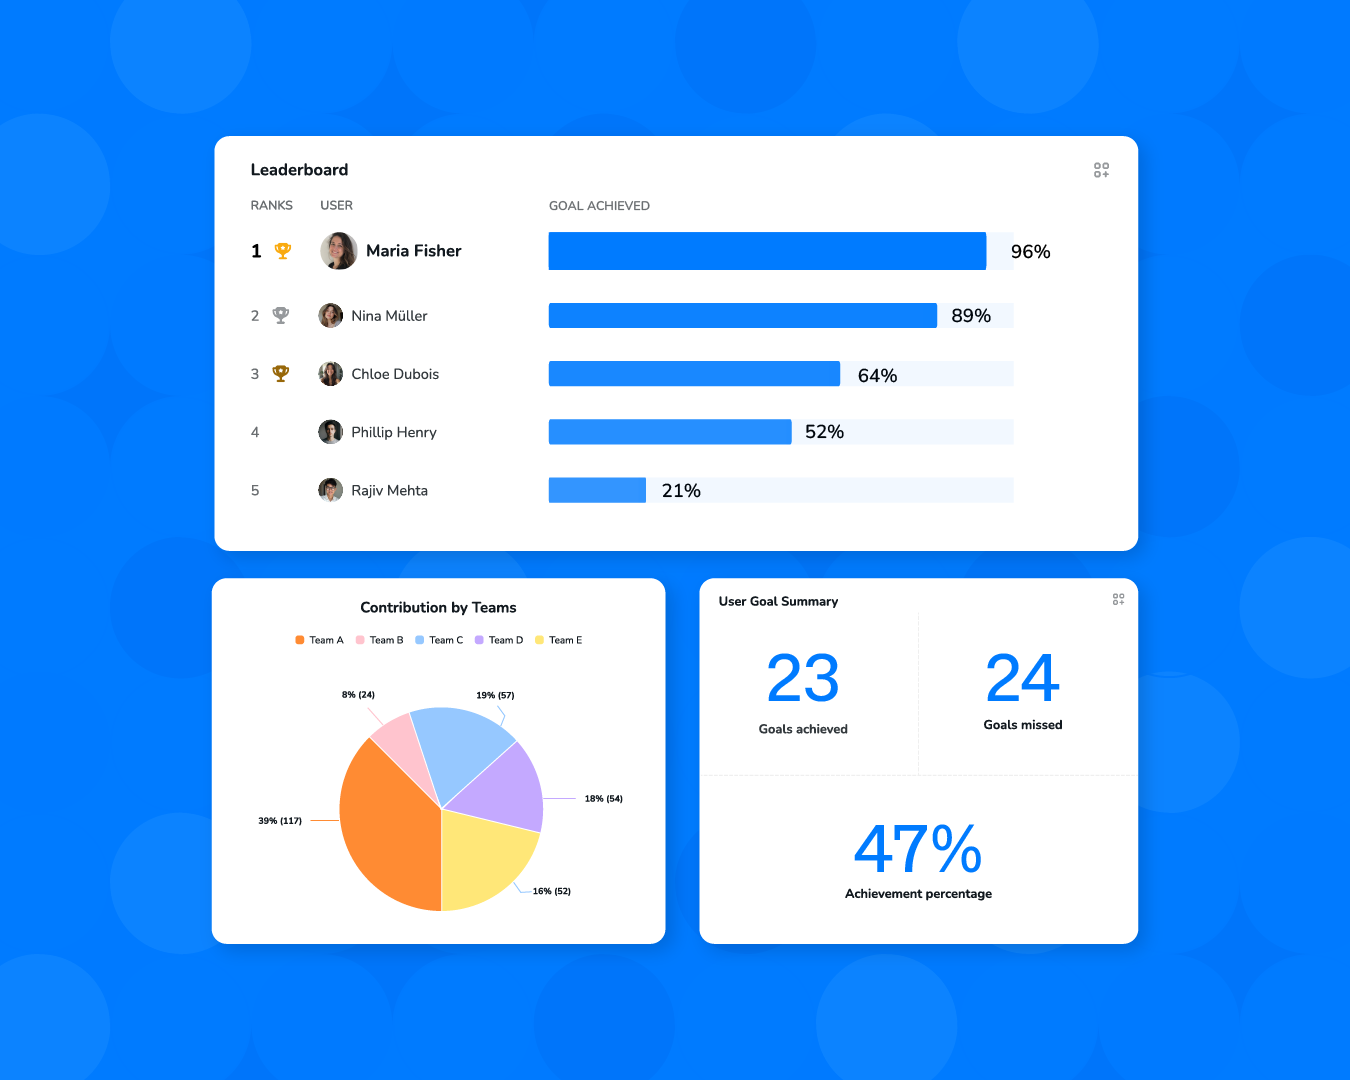
Goal tracking stays simple:
- Name the goal
- Select the metric and filters
- Set the target and frequency
![]()
Performance is visualised in real time (on track, at risk, off track), with automated alerts flagging gaps early.
Leaderboards surface coaching opportunities, and role-based dashboards keep every user focused on the numbers that matter.
Want to see where your current reporting setup might be slowing you down?
Book a 15-minute call — we’ll show you where your ATS may be leaking time and revenue.
Frequently Asked Questions
What are the most important recruitment KPIs for firms?
If you had to watch just a handful of numbers, start with Gross Profit per Recruiter, Time to Fill, Job Take-to-Fill Ratio, CCI-to-Placement Ratio, Offer Acceptance Rate, and EBIT margin.
Together, these tell you whether your team is actually turning effort into revenue. The exact mix can vary, but if these move in the right direction, your business usually does too.
How often should recruitment KPIs be tracked?
Your delivery metrics — submissions, interviews, pipeline movement — should be checked weekly. Financial KPIs like gross profit and EBIT can be reviewed monthly or quarterly.
What matters more than the cadence, though, is how quickly you can see problems forming. Laggy reporting is where most firms get caught off guard.
What is a good Time to Fill benchmark?
For most perm and specialist roles, landing in the 28–35 day range is considered strong. Executive searches naturally take longer — usually 60–90 days.
But benchmarks are only half the story. If your Time to Fill is quietly stretching month over month, that’s the signal to pay attention to.
How can recruitment software improve KPI tracking?
Good recruitment software captures performance data automatically while recruiters work. That means live dashboards, early warnings, and far fewer spreadsheet fire drills.
The real win isn’t prettier charts — it’s being able to spot pipeline or productivity problems before they hit revenue.
Which recruitment KPI impacts revenue the most?
If you follow the money, Gross Profit per Recruiter and Job Take-to-Fill Ratio usually sit closest to revenue.
One tells you how productive your billers are. The other tells you whether the work you’re taking on is actually converting. When both improve, revenue typically follows.
How many recruitment KPIs should a firm track?
Most well-run firms keep a tight grip on 5–10 core KPIs, then use supporting metrics to diagnose issues.
Track too many and you drown in dashboards. Track too few and problems sneak up on you. The sweet spot is focused visibility.
What is a healthy recruiter productivity benchmark?
It varies by market, but many strong perm recruiters generate somewhere in the $200K–$300K+ gross profit range annually, with top performers well beyond that.
More useful than the headline number is the trajectory. Consistent upward movement usually tells you more than any single snapshot.
How do you improve recruitment KPIs?
In most firms, the biggest gains come from three places:
- Qualifying roles more tightly upfront
- Matching candidates more accurately
- Removing manual admin from the workflow
Fix the friction in search, screening, and follow-ups, and most KPI improvements follow surprisingly quickly.
What recruitment KPI do investors look at first?
Experienced buyers usually go straight to EBIT margin, Gross Profit per Recruiter, and revenue predictability.
Why? Because strong billings are nice — but scalable, repeatable economics are what actually drive valuation.
Recruitment

Ayusmita is a B2B storyteller who spends her time translating messy, human recruiting workflows into clear stories that help teams work smarter, not harder. Big believer in human-first optimization, she writes for people who prefer clarity over complexity and conversations over checklists.


Ayusmita