
25 Recruitment Metrics to Track in 2026

In this blog we will discover the 25 recruiting metrics to track in 2026, each with a plain formula, and flags the five that the data shows predict revenue.
A Quick refresher: What are recruitment metrics?
Recruitment metrics are measurements that track the health and output of a recruiting desk, from how fast roles close to how much revenue each recruiter generates.
A metric becomes a KPI, a key performance indicator, when you decide it is important enough to steer the business by.
Every KPI is a metric; not every metric deserves to be a KPI.
The categories below move from activity to money. The closer a metric sits to revenue, the more weight it deserves.
A. Speed metrics
1. Time to Fill.
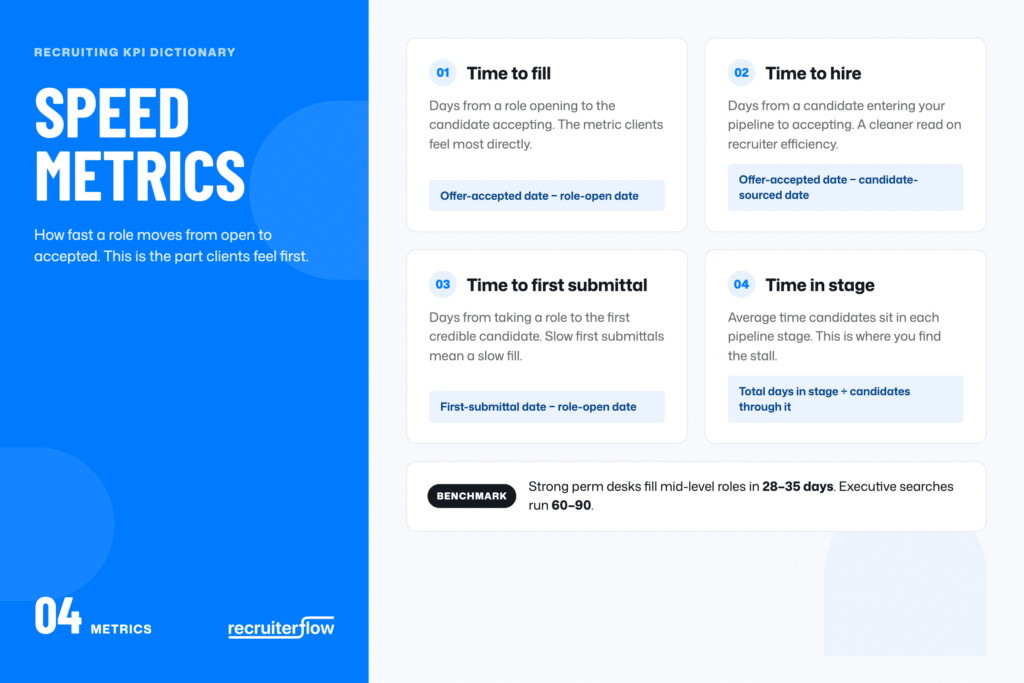
The number of days from a role opening to the candidate accepting the offer. It is the metric clients feel most directly. Formula: offer-accepted date minus role-open date. See how to reduce time to fill for the levers that move it.
2. Time to Hire.
The days from a candidate first entering your pipeline to accepting the offer. It isolates the speed of your process once a qualified person is in play, so it is cleaner than time to fill for judging recruiter efficiency. Formula: offer-accepted date minus candidate-sourced date. The time to hire guide covers how it differs from time to fill.
3. Time to First Submittal.
The days from taking a role to putting the first credible candidate in front of the client. It is an early warning: slow first submittals usually mean a slow fill. Formula: first-submittal date minus role-open date.
4. Time in Stage.
The average time candidates spend in each pipeline stage, which shows you where deals stall. Formula: total days in a stage divided by candidates who passed through it.
B. Funnel and conversion metrics
5. Submittal-to-Interview Ratio.
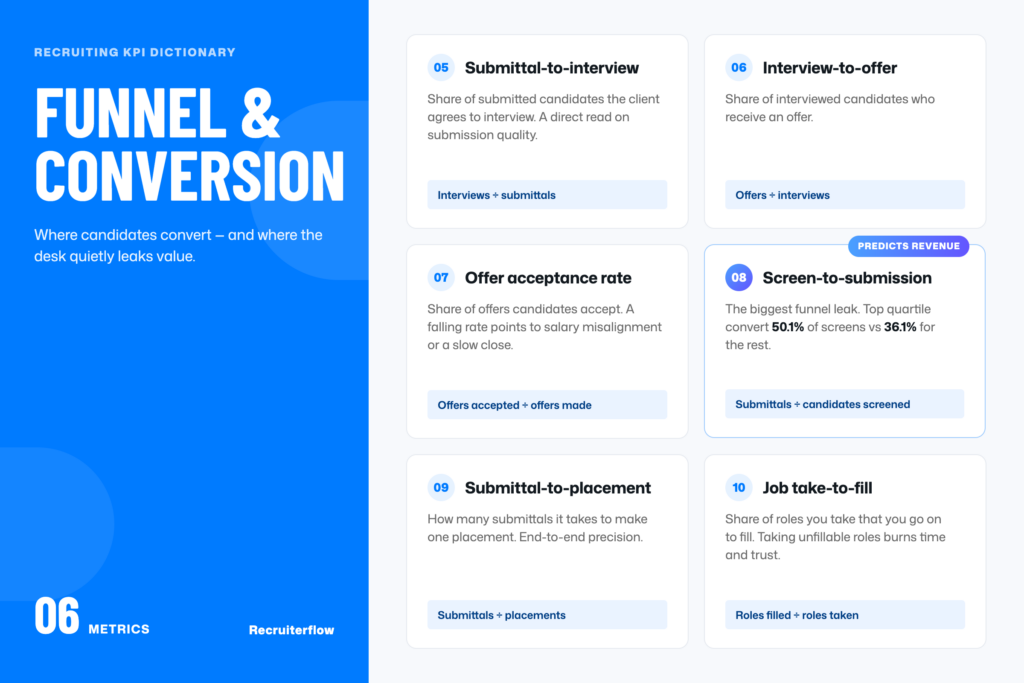
The share of submitted candidates the client agrees to interview, a direct read on submission quality. Formula: interviews divided by submittals.
6. Interview-to-Offer Ratio.
The share of interviewed candidates who receive an offer. Formula: offers divided by interviews.
7. Offer Acceptance Rate.
The share of offers candidates accept. A falling rate points to salary misalignment or a slow close. Formula: offers accepted divided by offers made.
8. Screen-to-Submission Rate.
The share of screened candidates you submit to a client. This is one of the five metrics that predict revenue, because it is where most desks quietly leak value (more below). Formula: submittals divided by candidates screened.
9. Submittal-to-Placement Ratio.
How many submittals it takes to make one placement, a measure of end-to-end precision. Formula: submittals divided by placements.
10. Job Take-to-Fill Ratio.
The share of roles you take on that you go on to fill, sometimes called fill rate. Taking roles you cannot fill burns time and client trust. Formula: roles filled divided by roles taken.
C. Activity and volume metrics
11. Submittals per Recruiter.
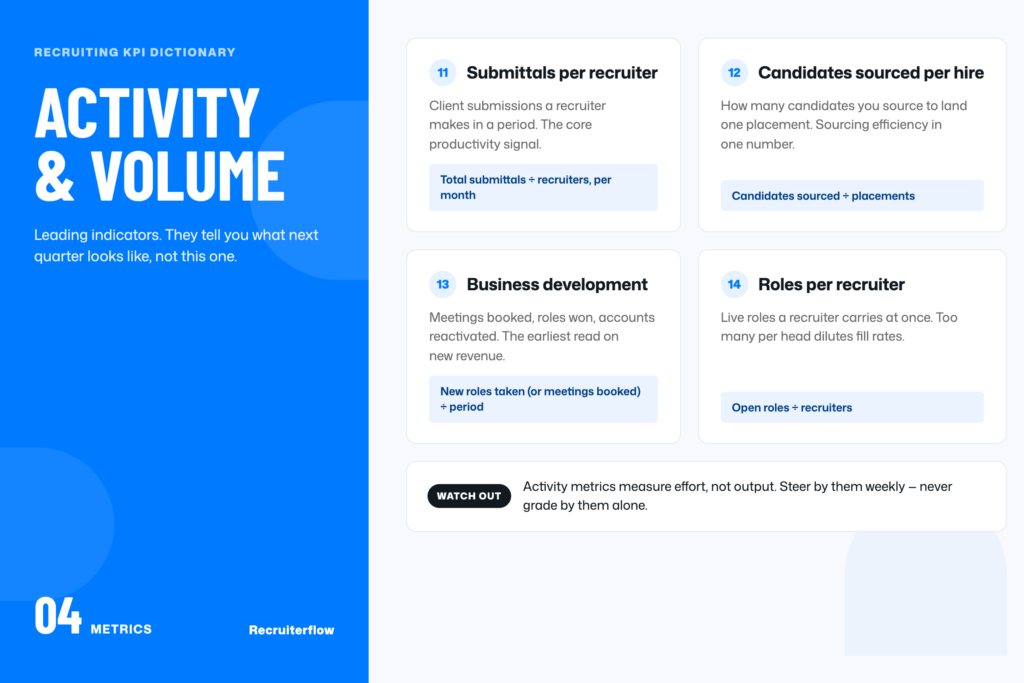
The number of client submissions a recruiter makes in a period, a core productivity signal. Formula: total submittals divided by recruiters, per month.
12. Candidates Sourced per Hire.
How many candidates you source to land one placement, which shows sourcing efficiency. Formula: candidates sourced divided by placements.
13. Business Development Activity.
Leading indicators of new revenue: client meetings booked, new roles won, or reactivated accounts per period. Formula: new roles taken (or meetings booked) divided by period.
14. Roles per Recruiter.
The number of live roles a recruiter carries at once. Too many roles per head dilutes fill rates. Formula: open roles divided by recruiters.
D. Financial metrics
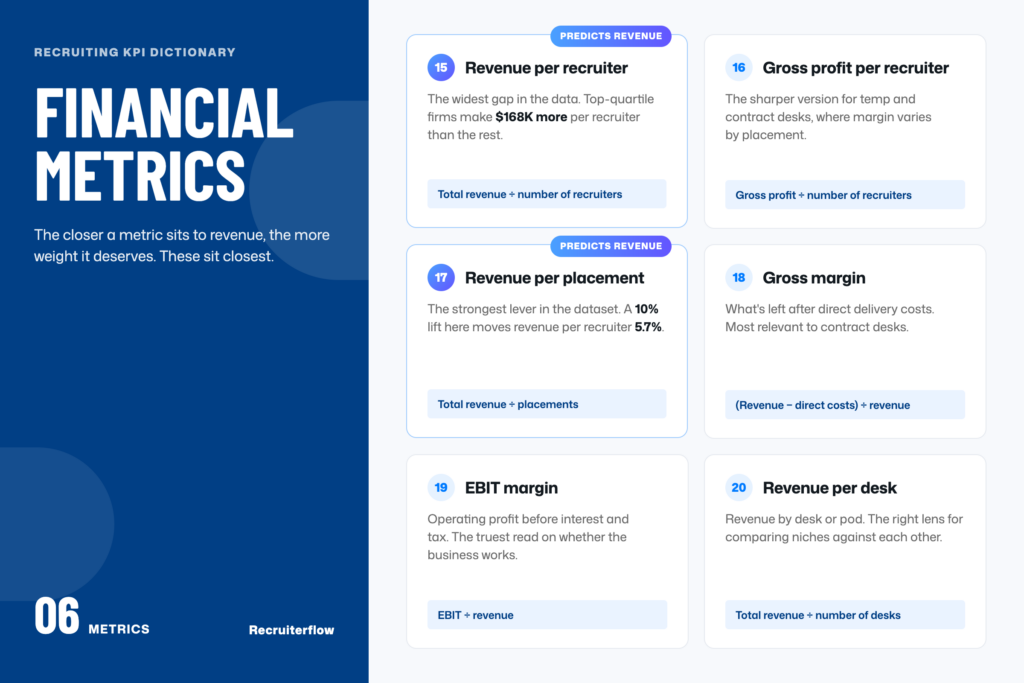
15. Revenue per Recruiter.
Fee revenue generated per recruiter, and one of the five metrics that predict revenue. Formula: total revenue divided by number of recruiters.
16. Gross Profit per Recruiter.
Gross profit per recruiter, the sharper version for temp and contract desks where margin varies. Formula: gross profit divided by number of recruiters.
17. Revenue per Placement.
The average fee per placement, also called average placement value, and another of the five revenue-predictive metrics. Formula: total revenue divided by placements.
18. Gross Margin.
The share of revenue left after direct delivery costs, most relevant to contract desks. Formula: revenue minus direct costs, divided by revenue.
19. EBIT Margin.
Operating profitability after costs but before interest and tax, the truest read on whether the business itself works. Formula: EBIT divided by revenue.
20. Revenue per Desk.
Revenue generated by a desk or team, useful for comparing niches and pods. Formula: total revenue divided by number of desks.
E. Quality and retention metrics
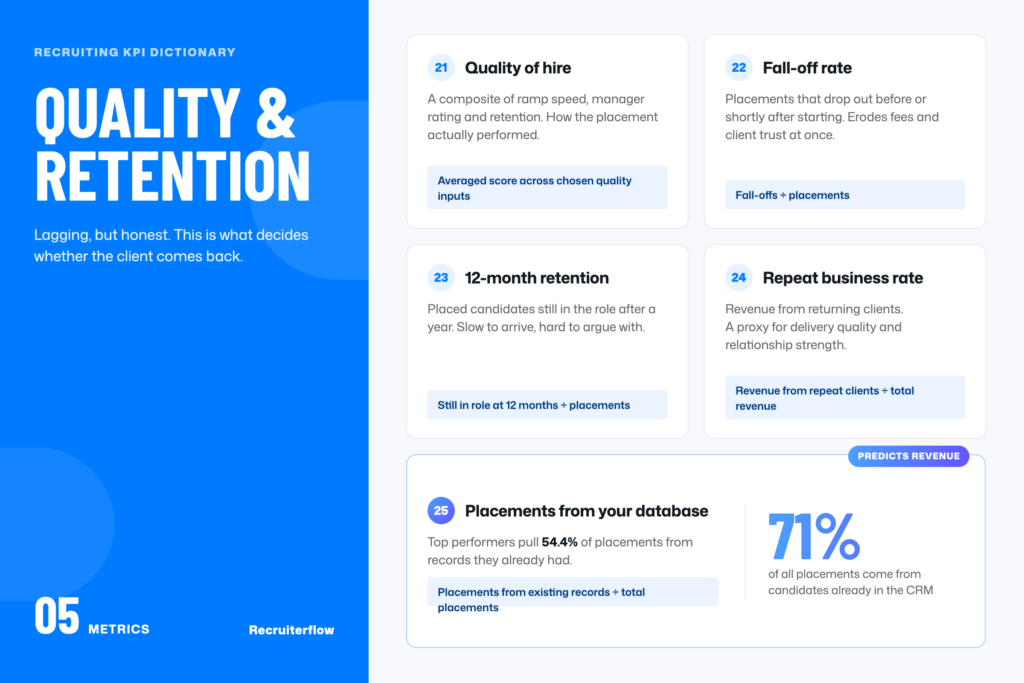
21. Quality of Hire.
A composite of how placed candidates perform and how long they stay, usually blended from ramp speed, manager rating, and retention. Formula: an averaged score across chosen quality inputs.
22. Fall-off Rate.
The share of placements that drop out before or shortly after starting, which erodes fees and client trust. Formula: fall-offs divided by placements.
23. 12-Month Retention Rate.
The share of placed candidates still in the role after a year, a lagging but honest quality signal. Formula: placements still in role at 12 months divided by placements.
24. Repeat Business Rate.
The share of revenue that comes from returning clients, a proxy for delivery quality and relationship strength. Formula: revenue from repeat clients divided by total revenue.
25. Percent of Placements from Your Database.
The share of placements sourced from candidates already in your CRM rather than net-new sourcing, often requiring secure remote access such as VPN, and the last of the five revenue-predictive metrics.
The 5 metrics that predict revenue
Most of the 25 are useful. Five are the ones the benchmark data ties directly to how much money a firm makes. Recruiterflow’s study of 2,100-plus firms, The Economics of Recruiting, found a clear separation between the top quartile and everyone else:
- Revenue per recruiter. The single widest gap. The top 25% of firms generate roughly $168,000 more revenue per recruiter than the rest.
- Revenue per placement. The strongest lever in the dataset: a 10% lift in revenue per placement corresponds to a 5.7% lift in revenue per recruiter, more than any speed or volume metric.
- Screen-to-submission rate. The biggest funnel leak. Top-quartile firms convert 50.1% of screens to submissions against 36.1% for the rest, and that one stage is where the gap opens widest.
- Placements per recruiter. This measures output rather than effort. The top 25% place 5.21 candidates per recruiter per year versus 1.38 for everyone else.
- Percent of placements from your database. Top performers pull 54.4% of placements from existing records against 48.6% for the rest, part of the reason 71% of all placements come from candidates already in the CRM (Source: The Economics of Recruiting).
If you only build dashboards for five numbers, build them for these.

How many metrics should you track?
A workable split: pick the five revenue-predictive metrics as your standing KPIs, add two or three operational metrics your desk is actively trying to fix (a weak screen-to-submission rate, a slow first submittal), and review the rest quarterly.
Check delivery metrics weekly and financial metrics monthly. For a sharper shortlist of what to steer by day to day, the guide to the recruitment KPIs that matter most is the companion to this reference.
FAQs
What’s the difference between a recruitment metric and a KPI?
A metric is any measurement of the recruiting process; a KPI is a metric you have chosen as a key indicator of success and steer the business by. Every KPI is a metric, but most metrics stay context rather than becoming KPIs. The skill is deciding which few earn KPI status.
How many recruitment metrics should a recruiting firm track?
Fewer than you think. Five to eight is plenty for most firms: the handful that predict revenue as standing KPIs, plus two or three you are actively working to improve. Tracking all 25 at once usually produces reports nobody acts on.
What are good benchmarks for time-to-fill and submittal ratios?
As general guidance, strong perm desks often fill mid-level roles in the 28 to 35 day range, while executive searches run 60 to 90 days. Submittal-to-interview ratios vary by niche, so your own trend line matters more than any single industry figure. Benchmark against your past performance first.
Which recruitment metrics matter most for executive search?
Executive search leans on revenue per placement, time to first submittal, quality of hire, and repeat-business rate more than raw volume. Fewer, higher-value searches mean each placement’s fee and each client relationship carries more weight than submittal counts.
What single metric best predicts a firm’s revenue?
Revenue per placement is the strongest single lever in the benchmark data, since raising the average fee flows almost directly to revenue per recruiter. Revenue per recruiter itself is the widest gap between top firms and the rest, so the two together tell most of the story.
Recruitment
Ayusmita is a B2B storyteller who spends her time translating recruiting workflows into clear stories at Recruiterflow.


Ayusmita