
Recruitment ROI in 2026: Complete Guide, Formulas & Metrics
Recruitment ROI usually shows up only in two situations: when budgets are cut, or when someone asks, “So… what did we actually get out of this?”
For years, most recruiting teams didn’t have to answer that question too precisely. As long as roles were getting filled and revenue was flowing, ROI stayed a spreadsheet problem for finance.
That’s no longer the case.
So we did the research and found out in our 2025–26 Recruitment Industry Analysis, permanent recruitment revenue declined by up to 13% year-over-year at large firms like Randstad and Robert Half, while margins stayed under sustained pressure.
When revenue tightens and cycles stretch, every recruiting decision suddenly needs justification.
Recruitment ROI answers that one uncomfortable question:
For every dollar (or hour) you spend on recruiting, what business value do you actually get back?
But First, What Is Recruitment ROI?
Recruitment ROI measures the business value generated from your recruiting efforts compared to what you invest in them: time, money, tools, and people.
That investment isn’t just recruiter salaries or agency fees. It includes:
- time spent sourcing, screening, interviewing, and coordinating
- cost of job ads, events, and recruitment marketing
- technology spend across ATS, CRM, assessments, and AI tools
- opportunity cost of roles staying open longer than planned
And the “return” isn’t just hires made.
It shows up as:
- roles filled faster or slower than expected
- quality of hires who perform, ramp, and stay
- reduced rework from misaligned or failed hires
- predictable pipelines instead of reactive scrambling
In simpler terms, recruitment ROI connects recruiting activity to business outcomes, not just recruiting volume.
This is why ROI in recruitment has become a board-level conversation. When recruitment slows, margins tighten, and decision cycles stretch, recruiting can’t be justified by effort alone. It has to be justified by impact.
And that’s exactly what recruitment ROI is meant to do.
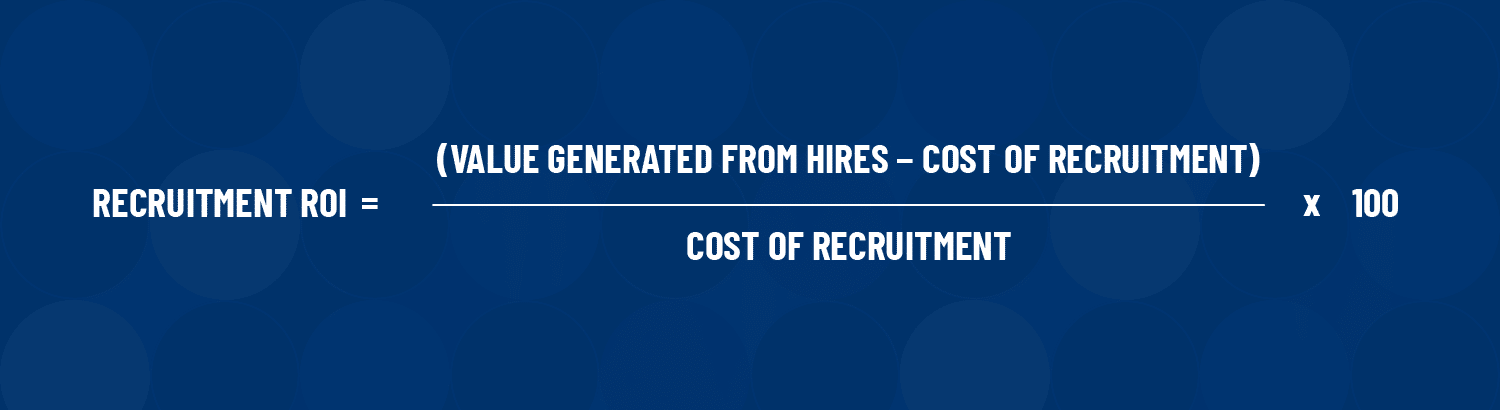
How to Calculate Recruitment ROI (Formula + Examples)
Recruitment ROI isn’t about whether a hire performs well after joining. For recruiting firms, it answers a more immediate question:
Is the revenue from this assignment worth the time and effort it consumes?
At a high level, the formula looks familiar:
The part most teams get wrong isn’t the formula, it’s defining Net Business Value and Total Recruitment Cost in a way that reflects how agencies actually operate.
Step 1: Define Total Recruitment Cost (what the search truly “cost” you)
For agencies, cost is not just job ads or a LinkedIn seat. The real driver is people time (recruiters + partners) plus the supporting spend that sits behind every search.
A clean way to model it:
|
What goes into each bucket:
- External spend: tool costs, job board ads (if used), enrichment tools, assessments, background checks you cover, contractor sourcers, event costs, etc.
- Recruiting team labor: recruiter/sourcer hours × a fully loaded hourly rate (salary + benefits + tools + overhead)
- Leadership/SME time: partner/principal time, practice lead time, interview panels, QA, etc. (often the hidden cost that quietly destroys ROI on “hard” searches)
A realistic note: most firms dramatically undercount partner time. If a principal spends 12–20 hours on calibration, outreach, shortlist reviews, and client calls, that’s not “free.”
Step 2: Define Net Business Value (what you actually “got back”)
For an agency, “value” should not be the candidate’s salary or the client’s ROI. Your ROI should be tied to what you earn and keep.
A practical definition:
| Net Business Value = Fees Collected + Direct Revenue Leakage |
Where “revenue leakage” can include:
- refunds/fee reductions
- free replacements under guarantee
- write-offs (role cancelled, client ghosting, no-placement work)
- pass-through costs you absorbed
This definition works for retained, exclusive, and contingency models without getting academic.
Example 1: A “Good” Search (Strong ROI, realistic numbers)
A mid/senior search closes.
Fees collected: $60,000
Your cost to deliver the search
- External spend (tools allocation, outreach tooling, data, etc.): $1,200
- Recruiter time: 70 hours × $65/hr = $4,550
- Sourcer/research support: 25 hours × $45/hr = $1,125
- Partner/principal time: 12 hours × $140/hr = $1,680
Total Recruitment Cost = $1,200 + $4,550 + $1,125 + $1,680 = $8,555
Assume no refund/replacement costs.
Net Business Value = $60,000
ROI = ($60,000 – $8,555) ÷ $8,555 × 100 = 601%
Example 2: A “Bad” Search (Negative ROI that agencies actually feel)
A search runs for 6–8 weeks, but the role gets paused/cancelled late-stage (or the client goes dark). No placement.
Fees collected: $0
Costs incurred
- External spend (tools allocation, enrichment, outreach tooling): $900
- Recruiter time: 55 hours × $65/hr = $3,575
- Sourcer/research support: 20 hours × $45/hr = $900
- Partner/principal time: 8 hours × $140/hr = $1,120
Total Recruitment Cost = $6,495
Net Business Value = $0
ROI = ($0 – $6,495) ÷ $6,495 × 100 = -100%
The numbers are estimates, but the logic holds: recruitment creates value beyond headcount.
Once you start breaking recruitment ROI into cost and value components, the next challenge is knowing which underlying metrics actually influence those numbers.
Read in depth here: Recruiting metrics that shape recruitment ROI.
Or, below is a quicker scan of the metrics to track.
Which Metrics Should You Consider to Measure Recruitment ROI?
Recruitment ROI is only as strong as the metrics behind it. Tracking too few creates blind spots; tracking too many without context creates noise.
For agencies, the goal isn’t to measure everything. It’s to track the metrics that explain where time, effort, and revenue are compounding and where they’re leaking.
Some metrics apply universally. Others matter more depending on your recruiting model and role mix.
1. Early attrition / replacement rate
Early attrition matters for agencies when it creates direct rework or revenue risk.
If a placement exits within a guarantee period, the firm often absorbs:
- free replacement work
- additional recruiter and partner time
- delayed or reduced revenue recognition
- strained client relationships
Formula (replacement rate proxy):
Replacement rate = (Placements requiring replacement ÷ Total placements) × 100
From an ROI perspective, every replacement turns a “successful” placement into a lower-margin assignment. Even a small increase in replacement rate can materially erode overall ROI.
2. Offer acceptance rate
Offer acceptance rate measures how often candidates say “yes” once an offer is made.
Formula:
Offer acceptance rate = (Offers accepted ÷ Offers extended) × 100
For agencies, low acceptance rates are expensive:
- searches stay open longer
- recruiter and partner time increases
- shortlists are rebuilt
- capacity is blocked without revenue
High acceptance rates signal strong alignment between client expectations, candidate targeting, and process discipline, all of which improve ROI.
3. Application completion rate (context-dependent)
Application completion rate shows how many candidates who start an application actually finish it.
Formula:
Application completion rate = (Completed applications ÷ Started applications) × 100
This metric is most relevant for inbound, hybrid, or volume-driven models. For retained or senior searches, it may be less applicable.
Where inbound pipelines matter, low completion rates mean paid traffic and sourcing effort are not converting into viable candidates, reducing recruitment marketing ROI.
4. Quality of hire (reframed for agencies)
Quality of hire is one of the most misunderstood ROI metrics.
For agencies, quality is not about internal performance reviews. It shows up as:
- placement stability beyond the guarantee period
- reduced replacement risk
- repeat business and client trust
There’s no single formula, but useful proxies include:
- retention beyond 6–12 months
- absence of replacement requests
- client satisfaction post-placement
High-quality placements protect ROI by reducing rework and increasing long-term client value. Poor-quality placements quietly destroy ROI, even when fees are strong.
5. Time to hire
Time to hire measures how long it takes to move from assignment kickoff to offer acceptance.
Formula:
Time to hire = Days between role kickoff and offer acceptance
Long time-to-hire impacts agency ROI by:
- increasing recruiter and leadership time per assignment
- blocking capacity for other searches
- increasing the likelihood of scope creep or drop-off
Faster recruiting improves ROI only when quality is maintained. Speed without discipline often leads to replacements later.
6. Cost per hire
Cost per hire is commonly tracked, but for recruiting firms it’s more useful to think in terms of cost per assignment.
Formula:
Cost per hire = Total delivery cost ÷ Completed assignments
This includes:
- recruiter and leadership time
- research effort
- external tools and sourcing spend
On its own, cost per assignment is incomplete. It becomes meaningful only when paired with:
- fees earned
- replacement risk
- time-to-completion
A lower delivery cost doesn’t guarantee higher ROI if the assignment drags on or fails to close.
14 Recruitment Metrics Recruiters Must Track
Bringing the metrics together
Recruitment ROI isn’t measured by a single metric. It emerges when these indicators are tracked together and over time.
Teams that measure ROI effectively:
- connect source to hire to performance
- track metrics by role, recruiter, and channel
- use recruitment dashboards to spot trends early, not after budgets are cut
This is where recruitment analytics and reporting matter most. ROI isn’t a static calculation; it’s a signal that helps teams decide where to invest, what to fix, and what to stop doing.
Tracking these metrics in isolation only gets you so far; recruitment ROI becomes meaningful when they’re connected across roles, sources, and outcomes.
Read more: How recruitment analytics connects recruiting metrics to business impact
Why Recruitment ROI Falls Apart Mid-Quarter (And What Fixes It)
Recruitment ROI usually looks fine at the planning stage.
Costs are estimated, targets are approved, and recruiting plans make sense on paper. The problem starts a few weeks in, when reality intervenes.
A critical role drags longer than expected. A recruiter spends disproportionate time on one client. A sourcing channel keeps producing applicants but fewer viable hires. None of this shows up in the original ROI calculation, yet all of it quietly changes the return you’re getting.
Most teams only discover this after the quarter ends.
At that point, ROI turns into a post-mortem instead of a control mechanism.
This is the gap recruiting reports are designed to close.
Recruiterflow’s recruiting reports make it possible to see how recruitment ROI is shifting as recruiting happens. By combining recruiter activity, source performance, pipeline movement, and outcomes in one place, teams can spot where costs are increasing without improving results — and intervene early.
Instead of asking “What went wrong last quarter?” recruiting leaders can answer:
- which roles are absorbing the most effort right now
- which sources are still producing high-quality hires
- where recruiter time is no longer translating into outcomes
That’s the difference between calculating recruitment ROI and actually managing it.
When ROI shifts mid-quarter, visibility matters more than retrospective analysis.
If you want to see how this kind of visibility works in practice: Book a demo
Conclusion
Recruitment ROI isn’t about proving that recruiting matters. It’s about understanding where it actually creates value and where it doesn’t.
2026 predictions say that distinction matters more than ever.
Hiring volumes are lower, approval cycles are longer, and the cost of a wrong or delayed hire is higher. In that environment, recruiting decisions can’t rely on activity metrics or intuition alone.
What recruitment ROI really offers is clarity:
- which roles justify higher investment
- which channels consistently deliver quality hires
- where time and spend are being wasted without improving outcomes
You don’t need a perfect ROI model to get there. You need consistent definitions, realistic estimates, and visibility into how recruiting inputs translate into results over time.
Teams that treat recruitment ROI as an ongoing signal, not a one-time calculation, make better trade-offs. They know when to slow down, when to double down, and when to change course.
If you want to move beyond static spreadsheets and see how recruiting costs, speed, and outcomes connect in one place, reporting and analytics become essential.
Frequently Asked Questions
What is the recruitment ROI formula?
The standard recruitment ROI formula is:
Recruitment ROI = (Value generated from hires – Recruitment cost) ÷ Recruitment cost × 100
While the formula itself is simple, the challenge lies in defining value consistently across different roles, especially for non-revenue or operational hires.
How do you calculate recruitment marketing ROI?
Recruitment marketing ROI compares the value generated by hires attributed to a specific campaign against the cost of that campaign. Effective measurement focuses on outcomes like qualified hires, time-to-fill, offer acceptance, and retention by source, rather than clicks or application volume alone.
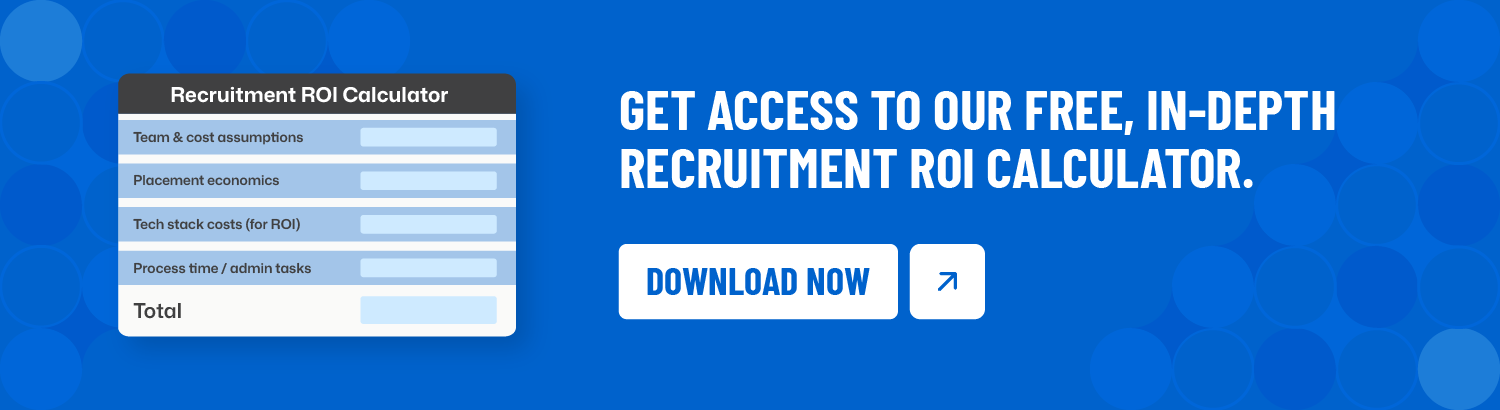
Is there a recruitment ROI calculator or estimator?
Many teams use basic recruitment ROI calculators or estimators built in spreadsheets to get started. These typically combine recruitment costs with estimated hire value. However, static calculators often fail to reflect changing recruiting conditions, making continuous recruitment ROI tracking more reliable than one-off estimates.
What is the ROI of recruitment software?
The ROI of recruitment software is measured by its ability to reduce recruiting costs, shorten time-to-fill, improve recruiter productivity, and increase recruiting quality. Software ROI should be evaluated based on measurable performance improvements, not just subscription pricing.
How do you evaluate AI recruitment platforms for ROI?
To evaluate AI recruitment platforms for ROI, focus on whether the technology measurably improves sourcing efficiency, screening accuracy, recruiter capacity, or recruiting speed. AI tools generate ROI only when they reduce manual effort or improve recruiting outcomes at scale.
How can teams track recruitment ROI over time?
Recruitment ROI tracking requires consistent definitions, role-level benchmarks, and visibility into recruiting outcomes across sources, recruiters, and time periods. Teams that track ROI continuously are better positioned to adjust strategy than those relying on periodic spreadsheet-based calculations.
Recruitment
Ayusmita is a B2B storyteller who spends her time translating messy, human recruiting workflows into clear stories that help teams work smarter, not harder. Big believer in human-first optimization, she writes for people who prefer clarity over complexity and conversations over checklists.


Ayusmita