How Recruitment Dashboard Can Transform Your Hiring?

Sifting through a sea of recruitment data can be challenging. Since it involves both candidate and client data, keeping it siloed will only complicate your analysis process. A recruitment dashboard organizes and displays all your recruitment data and helps you make quick decisions and find everything within a few clicks!
This article discusses recruitment dashboards in detail and how they can help transform your hiring. We’ll also dive into the process and best practices of creating a recruitment dashboard for your recruitment agency.
What is a Recruitment Dashboard?
A recruitment dashboard is a centralized location that gives the complete overview of all your recruitment metrics, key performance indicators (KPIs), and reports.
It usually extracts dynamic and real-time data from your database. With the recruiting dashboard, you get insights such as:
- The number of candidates moving forward in your recruitment cycle
- The number of touchpoints of candidate sourcing.
You can choose what you want to see on your dashboard and customize it based on your preferences.
Benefits of using recruitment dashboards
With a recruitment dashboard by your side, you’re not just making guesses—you’re making data-driven decisions.
Here are the various benefits of using a recruitment dashboard.
- Shows the bigger picture: Imagine having a bird’s-eye view of your entire recruitment journey, from the first application to sealing the deal. Spotting trends and gaps becomes a breeze when you can see it all at once.
- Allows you to hire smart: You can track recruitment metrics like time-to-fill and cost-per-hire, effortlessly. It’s not just about hiring fast anymore—it’s about hiring wisely.
- Enhances efficiency: No more drowning in paperwork or losing yourself in endless email chains. Using a recruitment dashboard, you can breeze through your tasks, and know exactly where each candidate stands and what needs your attention.
- Visibility into your leads pipeline: You can see how your leads (clients and candidates) are coming through and what stage of their journey they’re at.
- Analysis of the current health of your pipeline: Let’s say, your dashboard shows an average 45-day time-to-fill for software engineers. And, you noticed that most hires from LinkedIn and a significant drop-off at the technical interview stage. This gives you the data and insights that you need to plan ahead which is one of the lead routing best practices.
What components should you track on your recruitment dashboard?
You can customize your recruitment dashboard as per your goals and only show data that’s most relevant to you.
However, here’s a list of general components usually available with most recruitment dashboards.
1. Overview of your entire recruitment process
This will be a high-level snapshot of your entire recruitment process. It gives you a peak into its overall health and performance.
This can include:
- Total open positions: The number of current job openings you’re actively recruiting for.
- Total applicants: The total number of candidates currently in the recruitment process.
- Placements: The number of successful hires made within a specific timeframe.
- Client satisfaction score: Feedback from clients regarding the quality of candidates and overall service.

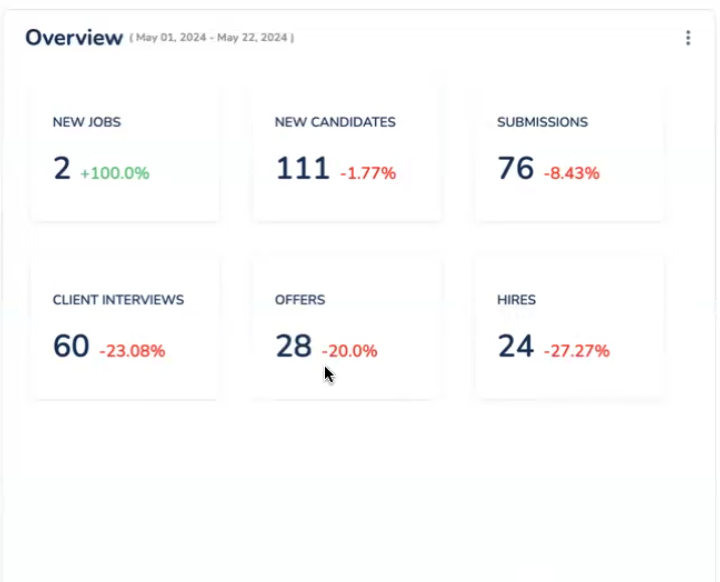
For example, in Recruiterflow, you can get details like:
- New jobs that are added to the software
- Number of new candidates that you can either manually add or extract from the “candidates” tab
- Number of candidate submissions you’ve done for a particular client
- Number of client interviews after they’ve received a list of candidates
- The number of offers your team has made recently
- The number of hires done
2. Recruitment metrics
You can also include recruitment metrics in your dashboard to keep track of your team’s performance and the effectiveness of your recruiting strategy.
Here’s everything you can measure:
- Time to fill
- Time to hire
- Cost per hire
- Revenue per recruiter
- Submittals per recruiter
- Candidate NPS score
And more!
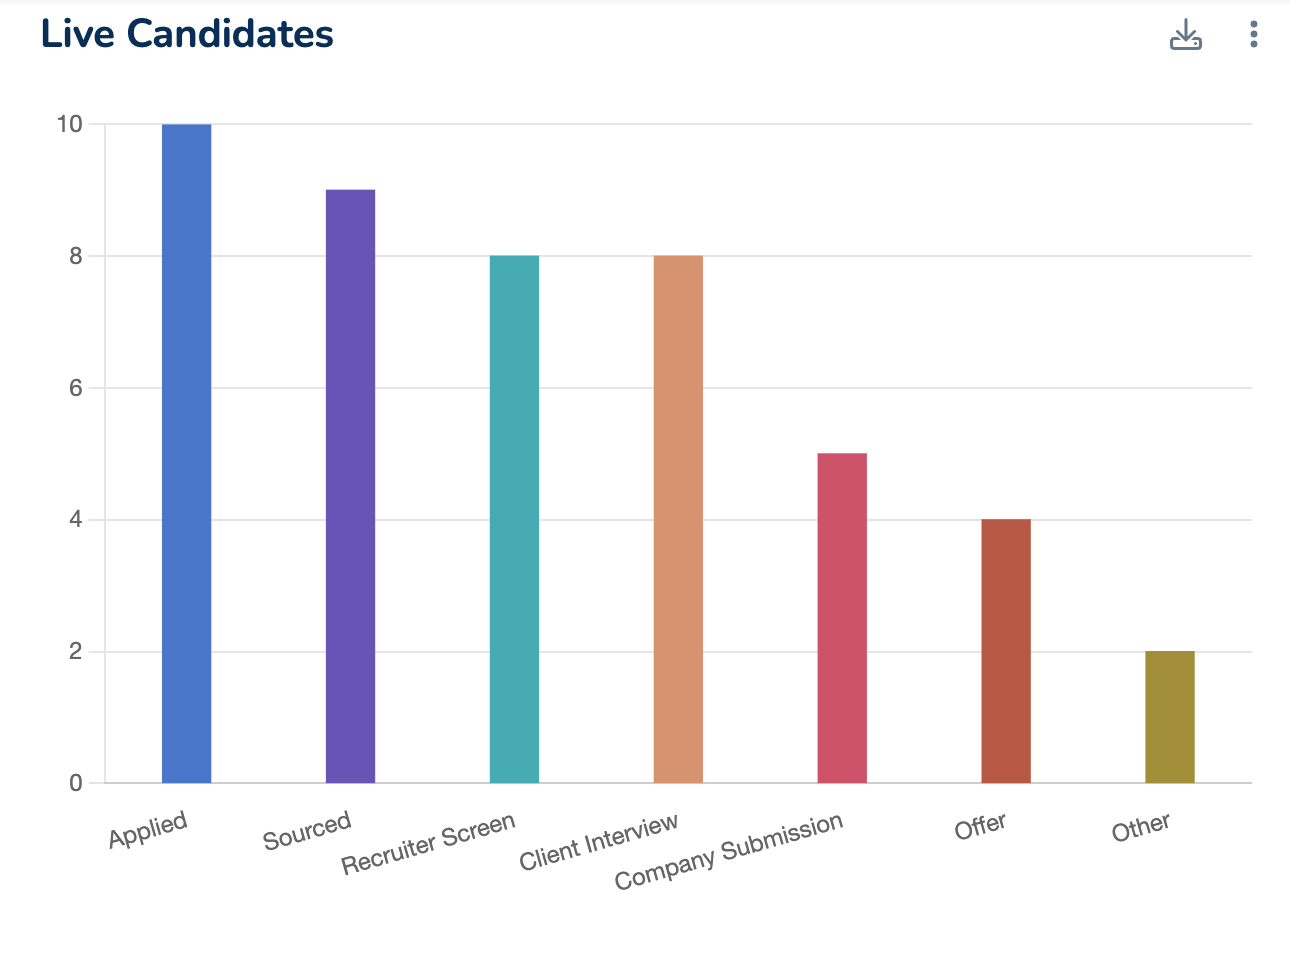
3. An overview of where your candidates are coming from
More precisely, it shows you the different stages through which the candidates navigate and the number of candidates in each stage.

- The number of candidates sourced
- The number of candidates that applied through your job posting
- The number of candidates that your team of recruiters screened and passed forward to the client
- The number of candidates you sent for client interviews
- The number of candidates you made an offer to
4. Placements
Recruiterflow’s dashboard also shows which candidates have gotten which jobs. It categorizes candidate data by company name and includes details like:
- Date of hiring
- Job profile
- Company name
- Candidate name
5. Applicant tracking details
Here, you can monitor and manage candidates’ progress through the recruitment pipeline.
Important metrics to track include:
- Applications received: The total number of applications submitted.
- Stage distribution: The number of candidates at each stage of the hiring process (e.g., application review, initial screening, interviews, offers).
- Pipeline velocity: The speed at which candidates move through each stage.
- Drop-off rates: The stages where candidates are exiting the process, helping identify bottlenecks or issues.
Note: With Recruiterflow, you can add as many widgets as you want in your dashboard to import data from specific functions of your ATS and CRM. You can build detailed recruiting reports to measure your performance and predict sales and revenue for your business!
To learn more about how Recruiterflow can help, click on the banner below to get a free demo at your convenient time.

How to Create a Recruitment Dashboard
1. Determine the key metrics to track
Identify the primary goals of creating the dashboard. Are you looking to streamline the hiring process? Or is your goal to improve candidate quality, enhance diversity, or reduce time-to-fill?
Based on your goals, you can identify the right metrics to analyze your recruitment efforts and get meaningful insights out of them.
Ask yourself these questions:
- How do we define a successful hire or a successful recruitment process?
- Are there specific stages where we often encounter delays or high drop-off rates?
- Where do you get your data from? Are these reliable sources?
- Is our data clean and accurate?
- How often is the ATS or recruitment software data updated — real-time, daily, or weekly?
- Are our hiring goals in sync with the company’s growth plans, diversity initiatives, or cost management strategies?
- Are there seasonal trends, or shifts in candidate behavior, we should be aware of?
2. Choose the right tools
Here are the types of tools you might want to consider:
Spreadsheets
Spreadsheet programs like Microsoft Excel and Google Sheets are useful for creating recruitment dashboards. They’re particularly ideal for small to medium-sized businesses.
The best part? They’re cost-effective and customizable.
Here’s how you can create your recruitment dashboard using spreadsheets:
- Gather recruitment data and enter it into a spreadsheet
- Summarize data to calculate key recruitment metrics.
- Visualize the summarized data using various chart types.
- Arrange charts and tables in a readable manner.
- Use slicers and filters to allow dynamic data exploration.
Examples of recruitment dashboard layouts in spreadsheet software
| Date | Candidate Name | Job Title | Source | Application Date | Interview Date | Hire Date | Status | Cost |
| 2023-05-01 | John Doe | Developer | 2023-04-01 | 2023-04-15 | 2023-04-30 | Hired | 500 | |
| 2023-05-02 | Jane Smith | Designer | Job Board | 2023-04-02 | 2023-04-16 | 2023-05-01 | Hired | 600 |
| … | … | … | … | … | … | … | … | … |
| Candidate Name | Interviewer | Job Title | Feedback Score (1-5) | Comments |
| John Doe | Alice Johnson | Developer | 4 | Strong technical skills |
| Jane Smith | Bob Williams | Designer | 5 | Excellent design portfolio |
| Sam Brown | Alice Johnson | Developer | 3 | Good, but lacks experience |
| Emily Davis | Chris Evans | Analyst | 4 | Great analytical skills |
| Michael Wilson | Alice Johnson | Developer | 5 | Outstanding problem-solving |
| Linda Taylor | Bob Williams | Designer | 4 | Creative and innovative |
| James Anderson | Chris Evans | Analyst | 2 | Needs more industry knowledge |
| … | … | … | … | … |
| Job Title | Openings | Applications Received | Interviews Conducted | Offers Made | Hires | Average Time-to-Fill (Days) | Average Cost-per-Hire |
| Developer | 5 | 50 | 30 | 10 | 5 | 28 | $600 |
| Designer | 3 | 40 | 25 | 8 | 3 | 26 | $575 |
| Analyst | 2 | 30 | 20 | 5 | 1 | 30 | $700 |
| … | … | … | … | … | … | … | … |
| Source | Applications | Interviews | Offers | Hires | Average Cost-per-Hire | Average Time-to-Fill (Days) |
| 20 | 15 | 5 | 3 | $600 | 25 | |
| Job Board | 15 | 10 | 3 | 2 | $580 | 27 |
| Referral | 10 | 8 | 2 | 1 | $550 | 24 |
| Website | 5 | 3 | 1 | 0 | $0 | 0 |
| … | … | … | … | … | … | … |
Recruitment analytics software
This is a more straightforward way of gathering all your recruitment data.
Most recruitment software offers in-built integration with Applicant Tracking Systems (ATS). This means your recruitment software will automatically populate data from candidate applications, interview schedules, and hire statuses.
Now, let’s talk about setting up your dashboard in this recruitment software:
- Integrate your recruitment software with your ATS, HRIS, and other relevant data sources.
- Get creative with the dashboard builder. Customize it to fit your style. Choose the metrics and visualizations that matter most to you.
- Add widgets to your dashboard, and tweak them to show exactly what you need.
- Keep things fresh. Schedule automatic data refreshes and reports to make sure your dashboard is always up-to-date.
- Share the love! Give access to your dashboard to hiring managers, HR teams, and anyone else who needs a peek into your recruitment insights.
3. Keep it simple and tidy
Simple recruiting dashboards engage users better and encourage them to interact with the data. Users are more likely to explore and act upon insights when they can quickly grasp the information presented using effective dashboard layout ideas.
This is why you shouldn’t aim to have all the data in one place. Instead, prioritize clarity and usability by only focusing on key metrics.
Here’s how to do it:
- Limit the visual clutter by removing unnecessary charts, graphs, or tables
- Use clear labels and annotations
- Group-related information to help users quickly locate the data they need
- Test and iterate the dashboard and make sure the layout meets the users’ needs
Crush your recruitment goals with targeted reporting
Recruitment is more than posting jobs and conducting interviews. Particularly, when you’re in a recruiting business, it’s more important than ever to adopt a strategic approach to scale your business.
This involves using data-driven insights to understand your current performance and predict the future implications of your efforts. And a recruitment dashboard offers just that!
To make your work easy, Recruiterflow comes with a built-in recruiting dashboard that extracts important metrics in a visual representation. This way, you don’t have to rely on a manual way of maintaining recruiting dashboards (like Spreadsheets), and you can quickly see all the relevant insights at a glance.
Book a Demo with Recruiterflow today!
Recruitment

